
Intracolony variation in Bryozoan Skeletal Index (BSI) through reconstructed and serially sectioned Devonian ramose trepostome bryozoans
Marcus M. Key, Jr., Patrick N. Wyse Jackson, Merlynd K. Nestell, and Catherine M. Reid
Key, M.M., Jr., Wyse Jackson, P.N., Nestell, M.K., and Reid, C.M. 2026. Intracolony variation in Bryozoan Skeletal Index (BSI) through reconstructed and serially sectioned Devonian ramose trepostome bryozoans. Acta Palaeontologica Polonica 71 (2): 211–218.
In the fields of functional morphology, paleoecology, and taxonomy, the Bryozoan Skeletal Index (BSI) is an increasingly useful metric for the degree of calcification in bryozoan colonies. The goal of this study is to quantify how it varies from proximal to distal through a colony’s growth transect. Colony fragments of the stenolaemate trepostome bryozoan Leptotrypella asterica from New York State, USA were reassembled into three large colonies. They are from the Kashong Shale Member of the Moscow Formation of the Hamilton Group deposited during the Givetian, Middle Devonian. Colonies were serially sectioned transversely from proximal to distal along the growth axis of the longest branches. To calculate BSI, three characters were measured: exozone width, zooecial wall thickness, and maximum autozooecial apertural diameter at the branch surface. Exozone width decreased significantly from proximal to distal through each colony’s growth transect. Zooecial wall thickness did not vary significantly. Maximum autozooecial apertural diameter decreased significantly in some of the colonies. BSI decreased significantly distally from their bases. We interpreted the distal colony branch tips with lower BSI values as being weaker and more susceptible to breakage. They could more easily break off and regrow without jeopardizing the success of the entire colony had the stronger proximal base with its higher BSI values broken.
Key words: Bryozoa, intracolony variation, Bryozoan Skeletal Index (BSI), Devonian, USA.
Marcus M. Key, Jr. [key@dickinson.edu; ORCID: https://orcid.org/0000-0003-4097-0143 ], Department of Geosciences, Dickinson College, 28 North College Street, Carlisle, PA 17013, USA.
Patrick N. Wyse Jackson [wysjcknp@tcd.ie; ORCID: https://orcid.org/0000-0001-5605-0670 ], Department of Geology, Trinity College, Dublin 2, Ireland.
Merlynd K. Nestell [nestell@uta.edu; ORCID: https://orcid.org/0000-0002-6825-3245 ], Department of Earth and Environmental Sciences, University of Texas, P.O. Box 19049, Arlington, TX 76019, USA.
Catherine M. Reid [catherine.reid@canterbury.ac.nz; ORCID: https://orcid.org/0000-0002-7204-2037 ], School of Earth and Environment, University of Canterbury, Christchurch 8140, New Zealand.
Received 8 December 2025, accepted 4 March 2025, published online 19 May 2026.
Copyright © 2026 M.M. Key, Jr. et al. This is an open-access article distributed under the terms of the Creative Commons Attribution License (for details please see http://creativecommons.org/licenses/by/4.0/), which permits unrestricted use, distribution, and reproduction in any medium, provided the original author and source are credited.
Introduction
Studying colonial animals in the fossil record is a challenge due to post-mortem fragmentation. Colony-level hypotheses can best be tested if fragmented colonies can be reconstructed. This study is another example of the benefit of using reassembled colonies by gluing together adjacent colony fragments (Cuffey and Fine 2006; Key et al. 2016; Wyse Jackson and Key 2019). Here we quantify intracolony Bryozoan Skeletal Index (BSI) values from proximal to distal through colonies’ growth transect in reassembled colonies from the Devonian of New York State, USA.
BSI is a measure of the degree of calcification in stenolaemate bryozoans (Wyse Jackson et al. 2020). It is calculated as ((EW×ZWT)/MZD)×100) using three morphometric characters: exozone width (EW), zooecial wall thickness (ZWT), and autozooecial apertural diameter (MZD) (Wyse Jackson et al. 2020). BSI has subsequently been utilized to demonstrate bryozoans’ response to changes in Paleozoic ocean chemistry (Key et al. 2022), variation in response to latitude (Reid et al. 2023) and as a taxonomic character in cryptostome and trepostome bryozoans (Wyse Jackson et al. 2023). Additionally, the Index has been adopted as an important measure in recent taxonomic studies (Ernst and Rodríguez 2023; Ernst and Buttler 2025) and indirectly compared to assess the high degree of calcification in extant cyclostomes (Batson et al. 2021).
It has been shown that BSI values vary depending where in the exozone the three characters are measured (Wyse Jackson et al. in press). The closer to the surface, the greater the exozone width and thus greater BSI values. If there are thicker zooecial walls and larger autozooecial apertural diameters through the exozone, then the increase in BSI values toward the colony surface is accelerated.
The main goal of this paper, which quantifies BSI values from proximal to distal through a colony’s growth transect, is to assess the degree of astogenetic variation in BSI exhibited within colonies as they grew upward. The null hypothesis is that there is no variation in BSI in a proximal-distal (developmental) transect through a single colony. If this BSI methodology is successful, then BSI could be applied as a new taxonomic character or to differentiate between paleoenvironments along a depth gradient.
Institutional abbreviations.—TCD, Geological Museum, Trinity College Dublin, Ireland.
Other abbreviations.—BSI, Bryozoan Skeletal Index; EW, exozone width; ZWT, zooecial wall thickness; MZD, maximum autozooecial apertural diameter; S, secondary branch.
Material and methods
This study is based on three large, reassembled colonies of the stenolaemate trepostome bryozoan Leptotrypella asterica (Fig. 1). They came from 42.784361° N, 77.888107° W on private property along Little Beards Creek, 1.5 km northeast of Leicester, Livingston County, New York State, USA. Stratigraphically, they are from the Kashong Shale Member, Portland Point Subformation of the Moscow Formation, Upper Hamilton Subgroup of the Hamilton Group (Gowan et al. 2006: fig. 2; Brett et al. 2023: table 2, text-fig. 58) which was deposited during the middle Givetian of the Middle Devonian (Brett et al. 2011: fig. 4, 2023: text-fig. 10), ~382 Ma (Becker et al. 2020: fig. 22.1). At that time, the study site was in Laurentia’s Appalachian foreland basin at ~30ºS (Blakey 2016).
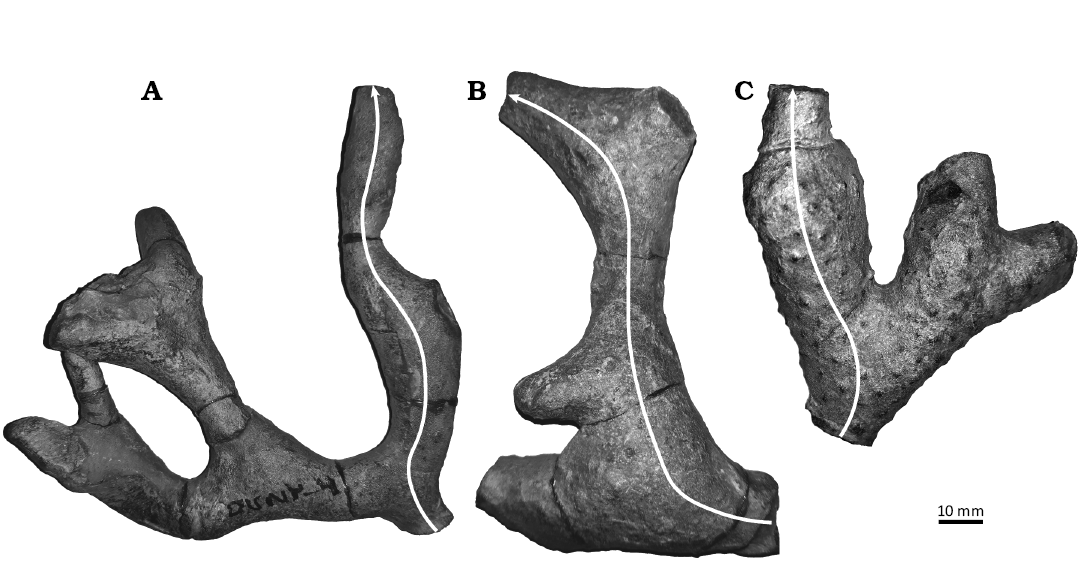
Fig. 1. Three reassembled colonies of the stenolaemate trepostome bryozoan Leptotrypella asterica Boardman, 1960 from the Hamilton Group of the Middle Devonian in Leicester, Livingston County, New York State, USA. Arrows indicate distal growth direction of longest branch chosen for serial sectioning. A. TCD.60477. B. TCD.60478. C. TCD.60479.
Broken colonies found in isolated concentrations on bedding planes were reassembled by gluing together adjacent colony fragments following the method of Key et al. (2016) (Fig. 1, Table 1). Each colony was serially sectioned transversely from proximal to distal along the growth axis of the longest branch. The transverse sections were oriented perpendicular to the growth axis of the branch sensu Boardman (1984: fig. 2). This methodology is in contrast to Boardman’s (1960) pioneering study which used continuous series of longitudinal sections along the growth axes of the branches. We found that due to the non-planar nature of the ramose colonies, longitudinal sections passed in and out of the plane of the branch growth axis. Transverse sections, which always cross the branch growth axis, yield more accurate exozone and endozone measurements than longitudinal sections. One longitudinal and one tangential thin section were also made from secondary branches for species identification.
Table 1. Colony, branch, billet, and serial section descriptive statistics of the three colonies of Leptotrypella asterica from the Hamilton Group of the Middle Devonian in Livingston County, New York, USA, used in this study.
|
Colony |
TCD.60477 |
TCD.60478 |
TCD.60479 |
|
Number broken fragments reassembled to form colony |
10 |
5 |
3 |
|
Total branch length (mm) |
104 |
124 |
86 |
|
Number of ~1.6-2.0 mm cuts |
19 |
20 |
12 |
|
Number of billets |
18 |
16 |
11 |
|
Range in billet thickness (mm) |
1.25–4.59 |
2.79–7.12 |
2.19–10.92 |
|
Mean billet thickness (mm) |
3.74 |
3.97 |
3.82 |
|
Number of serial sections |
38 |
33 |
19 |
|
Range in serial section spacing (mm) |
1.6–4.59 |
2.0–7.12 |
2.0–10.92 |
|
Mean serial section spacing (mm) |
2.72 |
3.02 |
2.92 |
The longest branch of each colony was cut transversely into segments approximately every 4 mm (Table 1). The alignment of each transverse cut was changed as needed to maintain a perpendicular orientation to the growth axis when the branch curved. The top and bottom of each of these billets was ground flat and polished to make two standard petrographic thin sections per billet following Nye et al. (1972). In order to determine the distance of each thin section from the colony base, each billet’s longitudinal thickness was measured before it was cut transversely across the middle before sectioning. By comparing these measurements to the pre-sectioned length of the branch, it was estimated that the 1.3 mm cutting blade combined with the grinding and polishing resulted in an average loss of 1.6–2.0 mm of the colony with each cut. Each cut thickness was cumulatively combined with the measured thickness of each billet to estimate distance from colony base for each thin section with an accuracy of ±0.7 mm.
We chose more labor-intensive serial thin sections as opposed to potentially more closely spaced serial acetate peels (e.g., 0.39 mm spacing by Key et al. 2001, 2002, 2011) due to the superior morphologic resolution and archival longevity of thin sections (Wyse Jackson and Buttler 2015). Use of thin sections also avoided inaccurate measurements due to post-peeling stretching of thin acetate. The thin sections and remnants from the three colonies have been lodged in the Geological Museum, Trinity College Dublin, catalogue numbers TCD.60477 to TCD.60479. This is the same material used by Key et al. (in press) to document astogenetic changes in branch diameter, endozone diameter, exozone width, and axial ratio.
Each thin section was scanned at 7200 dpi with a PrimeFilm 7250 Plus slide scanner. From the digital scans of the transverse sections, the following morphometric characters were measured and calculated to quantify astogenetic colony morphogenesis from the base to the growing tip of the longest branch. All measurements were made using ImagingSource’s IC Measure software version 2.0.0.286 to the nearest 0.01 mm. Repeatability experiments showed <2.2% measurement error.
To calculate Wyse Jackson et al.’s (2020) Bryozoan Skeletal Index (BSI = ((EW×ZWT)/MZD)×100), three characters were measured. Exozone width (EW) was measured based on the exozone-endozone boundary being defined by the initiation of the thickening of the intrazooecial walls. EW was measured four times per transverse section at the four major cardinal points and averaged (Fig. 2). Zooecial wall thickness between adjacent autozooecial apertures (ZWT) and maximum autozooecial apertural diameter at the branch surface (MZD) were each measured four times per transverse section at the four major cardinal points and averaged (Fig. 2). The complete data set is available as SOM 1 (Supplementary Online Material available at http://app.pan.pl/SOM/app71-Key_etal_SOM.pdf ).
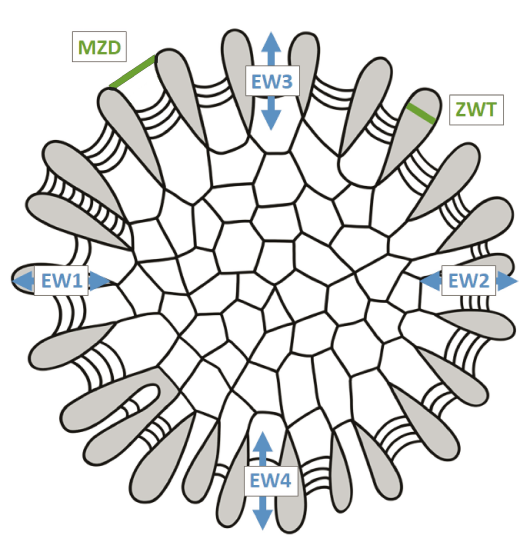
Fig. 2. Schematic diagram of a transverse thin section showing the morphometric characters measured in this study. EW, exozone width; MZD, maximum autozooecial apertural diameter at the branch surface; ZWT, zooecial wall thickness between adjacent autozooecial apertures. Grey indicates thick exozonal autozooecial walls. Closely spaced concave-out curved lines are exozonal basal diaphragms.
Results
Each of the three colonies were reassembled from three to 10 fragments (Table 1). The selected branches ranged from 86 to 124 mm long (Table 1). Of the 45 billets cut, a total of eight (9%) of the 90 attempts at thin sectioning failed due to breakage or too thin of a billet to make the two thin sections (TCD.60477 = 0, TCD.60478 = 3, TCD.60479 = 5). Despite this, the serial sectioning resulted in a mean spacing of 2.9 mm (Table 1). On each thin section, four replicates of each of the three characters (EW, ZWT, MZD) were measured resulting in a total of 1080 individual measurements (Table 2).
Table 2. Descriptive statistics of the morphometric characters measured on the three colonies of Leptotrypella asterica from the Hamilton Group of the Middle Devonian in Livingston County, New York, USA, used in this study. Abbreviations: BSI, Bryozoan Skeletal Index; EW, exozone width; MZD, maximum autozooecial apertural diameter; ZWT, zooecial wall thickness.
| |
Colony |
TCD.60477 |
TCD.60478 |
TCD.60479 |
|
EW (mm) |
Count |
38 |
33 |
19 |
|
Range |
0.65–3.05 |
1.90–5.51 |
0.79–6.21 |
|
|
Mean |
1.84 |
3.36 |
3.19 |
|
|
Standard deviation |
0.65 |
0.99 |
1.41 |
|
|
Coefficient of variation |
35 |
30 |
44 |
|
|
ZWT (mm) |
Count |
38 |
33 |
19 |
|
Range |
0.041–0.070 |
0.044–0.091 |
0.043–0.075 |
|
|
Mean |
0.057 |
0.060 |
0.063 |
|
|
Standard deviation |
0.007 |
0.010 |
0.008 |
|
|
Coefficient of variation |
12 |
16 |
13 |
|
|
MZD (mm) |
Count |
38 |
33 |
19 |
|
Range |
0.18–0.28 |
0.21–0.28 |
0.18–0.26 |
|
|
Mean |
0.24 |
0.25 |
0.22 |
|
|
Standard deviation |
0.02 |
0.02 |
0.02 |
|
|
Coefficient of variation |
10 |
7 |
10 |
|
|
BSI (mm-1) |
Count |
38 |
33 |
19 |
|
Range |
13–72 |
37–127 |
27–183 |
|
|
Mean |
44 |
82 |
90 |
|
|
Standard deviation |
15 |
24 |
42 |
|
|
Coefficient of variation |
35 |
29 |
46 |
Statistically significant morphometric trends distally through the colonies were defined using standard linear regression where a P value of <0.05 rejected the null hypothesis (Table 3). Exozone width decreased significantly distally through the colonies from their bases with negative slopes (Fig. 3), R2 values 0.7657–0.8090, and P values <0.0001 (Table 3, Fig. 3). Zooecial wall thickness between adjacent autozooecial apertures did not vary in any significant pattern distally through the colonies from their bases with R2 values <0.0669 and P values >0.1114 (Table 3, Fig. 4). Maximum autozooecial apertural diameter decreased significantly distally through the colonies in two (TCD.60477 and TCD.60479) of the three colonies with negative slopes and R2 values of 0.1366 and 0.4145 and P values of 0.0224 and 0.0029, respectively (Table 3, Fig. 4). In the other colony (TCD.60478), it did not vary in any significant pattern distally (Table 3). Bryozoan Skeletal Index decreased significantly distally through the colonies with negative slopes, R2 values 0.6552–0.7940, and P values all <0.0001 (Table 3, Fig. 5). This trend appeared despite branch thickening associated with secondary branch bifurcations (Fig. 5).
Table 3. Linear regression statistics of the morphometric characters measured on the three colonies of Leptotrypella asterica from the Hamilton Group of the Middle Devonian in Livingston County, New York, USA, used in this study. Abbreviations: BSI, Bryozoan Skeletal Index; EW, exozone width; DCB, distance from colony base; MZD, maximum autozooecial apertural diameter; ZWT, zooecial wall thickness.
|
x vs. y |
Colony |
TCD.60477 |
TCD.60478 |
TCD.60479 |
|
EW |
linear equation |
y = -42.297x + 132.01 |
y = -25.902x + 143.73 |
y = -10.693x + 66.107 |
|
R2 |
0.7816 |
0.8090 |
0.7657 |
|
|
P |
<0.0001 |
<0.0001 |
<0.0001 |
|
|
ZWT vs. DCB |
linear equation |
y = -1174.7x + 121.1 |
y = 272.99x + 40.158 |
y = -550.76x + 66.49 |
|
R2 |
0.0689 |
0.0083 |
0.0669 |
|
|
P |
0.1114 |
0.6143 |
0.2849 |
|
|
MZD vs. DCB |
linear equation |
y = -509.59x + 174.41 |
y = 45.737x + 45.373 |
y = -525.38x + 148.67 |
|
R2 |
0.1366 |
0.0007 |
0.4145 |
|
|
P |
0.0224 |
0.8838 |
0.0029 |
|
|
BSI vs. DCB |
linear equation |
y = -1.8008x + 133.88 |
y = -0.9958x + 138.22 |
y = -0.3345x + 62.064 |
|
R2 |
0.7940 |
0.6723 |
0.6552 |
|
|
P |
<0.0001 |
<0.0001 |
<0.0001 |
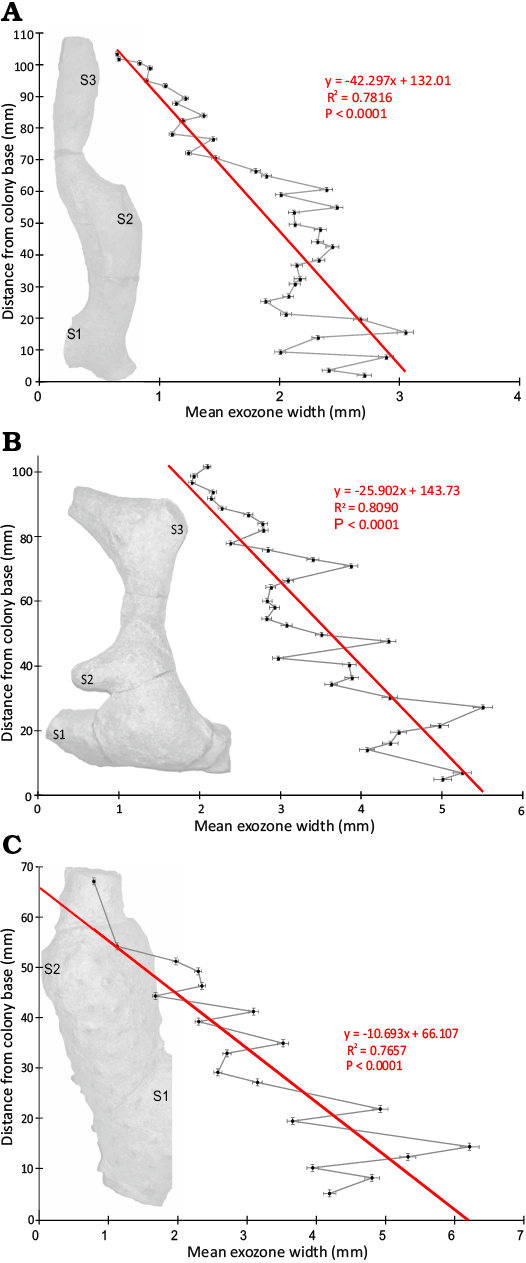
Fig. 3. Plots of mean exozone width from proximal to distal through a colony’s growth transect in the three colonies of Leptotrypella asterica from the Hamilton Group of the Middle Devonian in Leicester, Livingston County, New York State, USA. Abbreviations: S1–3 indicate secondary branches bifurcating off primary branch. A. TCD.60477. B. TCD.60478. C. TCD.60479.
Discussion
Sampling density.—Our serial transverse sectioning resulted in a mean spacing of 2.9 mm (Table 1). This spacing is 5× the sampling density of Boardman’s (1960) study which averaged a mean spacing of 14.3 mm (i.e., 17 data points over 350 mm, 20.6 mm mean spacing; eight data points over 75 mm, 9.4 mm mean spacing; and 13 data points over 170 mm, 13.1 mm mean spacing; in reconstructed colonies of Leptrotrypella aterica and L. multitecta [Boardman 1960: figs. 14, 15, and 21, respectively]). This spacing may represent the most densely sampled thin-section-based study of intracolony morphometric variation in a trepostome species.
Astogenetic variation.—The main goal of this paper, which quantifies BSI values distally from proximal to distal through a colony’s growth transect, is to assess the degree of astogenetic variation in BSI exhibited within colonies as they grew. This intracolony morphologic variation is due to both astogeny (i.e., the ontogeny of the colony) and the ontogeny of the individual zooids. Here we focus solely on astogenetic intracolony morphologic variation. For example, we measured zooecial wall thickness between adjacent autozooecial apertures and maximum autozooecial apertural diameter distally through the colonies (astogeny), not distally through zooids (ontogeny).
Colony TCD.60478 exhibited slightly different astogenetic patterns, especially for MZD. It was the only colony with no significant trend for this character (Table 3). We attribute this to it being the longest colony, with the widest mean billet thickness and thus the greatest mean serial section spacing (Table 1). The slightly coarser sampling may have masked the underlying astogenetic pattern in MZD seen in the other two colonies.
The widening exozone proximally (Fig. 4) supports the model of endozonal thinner walled zooids growing faster distally than the exozonal thicker walled zooids which are growing more slowly laterally (Boardman 1960; Madsen 1987). Key (1990) used the isochronous surfaces defined by remnant endozonal growing tips to show that the rate of skeletal secretion per zooid was higher in the endozone than the exozone. This suggests that in larger colonies it is only the distal parts that have feeding zoids. The proximal parts do not have feeling zooids and the walls are thickened for strength.
Our results provide no insight into the timing or spacing of secondary branch bifurcations. Long longitudinal sections should be more useful for that than the transverse sections in this study.
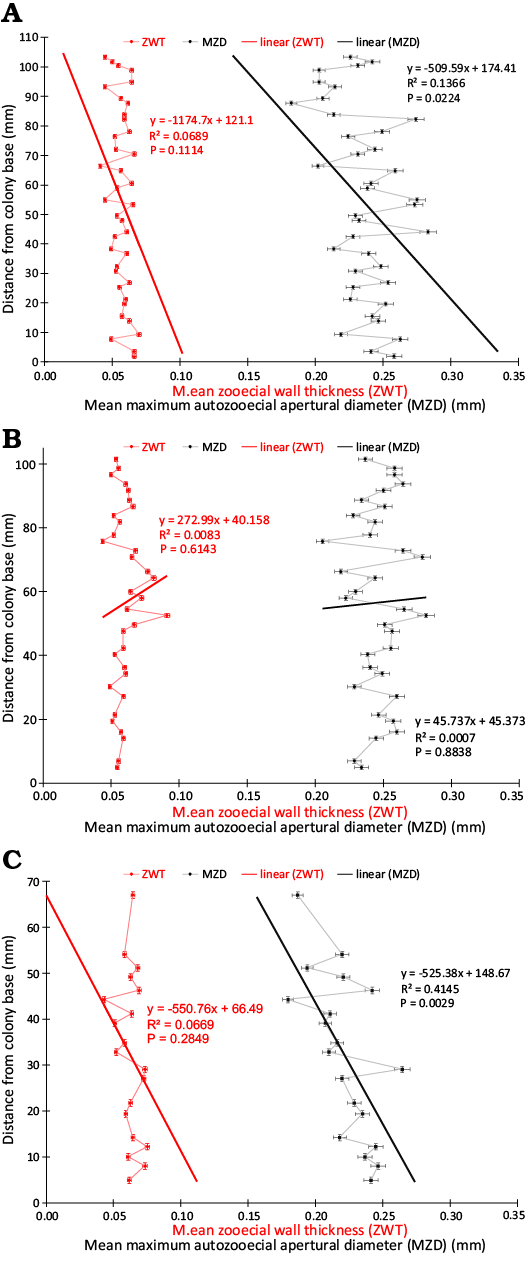
Fig. 4. Plots of mean zooecial wall thickness and mean autozooecial apertural diameter from proximal to distal through a colony’s growth transect in the three colonies of Leptotrypella asterica from the Hamilton Group of the Middle Devonian in Leicester, Livingston County, New York State, USA. A. TCD.60477. B. TCD.60478. C. TCD.60479. Abbreviations: MZD, maximum autozooecial apertural diameter; ZWT, zooecial wall thickness.
Utility as taxonomic characters.—To determine which of the morphometric characters use in this study are good characters for taxonomic identification, we compared how much intra- and inter-colony variation they exhibit. Due to the differences in the magnitude (i.e., by an order of three) of the characters (e.g., mean ZWT = 0.060 whereas mean BSI = 72), we used the coefficient of variation (CV) to compare the variability of the different characters. CV standardizes the variation to the mean using the equation CV (%) = standard deviation/mean*100. A smaller CV generally means a better taxonomic character, but this depends on the distance between the group means and within group variation. A larger CV within groups could be present, but if the between group means are radically different it would still be a useful character to differentiate groups.
Of the traditional branch morphometric characters (i.e., exozone width, endozone diameter, branch diameter, and axial ratio), EW varies the most (mean CV = 36%) in response to normal astogenetic growth of the colony (Key et al. in press). Of the four characters measured in this study, ZWT and MZD had the lowest CVs (i.e., 14% and 9%, respectively). BSI had the highest CV at 37%. This is to be expected as BSI values are dominated by EW, not ZWT or MZD (Wyse Jackson et al. in press). Therefore, ZWT and MZD may be more useful taxonomic characters than EW or BSI due to the former’s reduced intraspecific variation.
To minimize intracolony variation, BSI is best measured just below the growing tips at a point along the branch where its diameter has attained its optimal thickness (Wyse Jackson et al. in press). The worst places to measure it is in proximal portions of colonies where secondary thickening from overgrowths may have occurred or at a point immediately before branch bifurcation points where branch thickness often increases (Wyse Jackson et al. in press). These are noted as S1–3 on the colonies in Fig. 5. BSI increases at these two types of locations due to increasing EW.
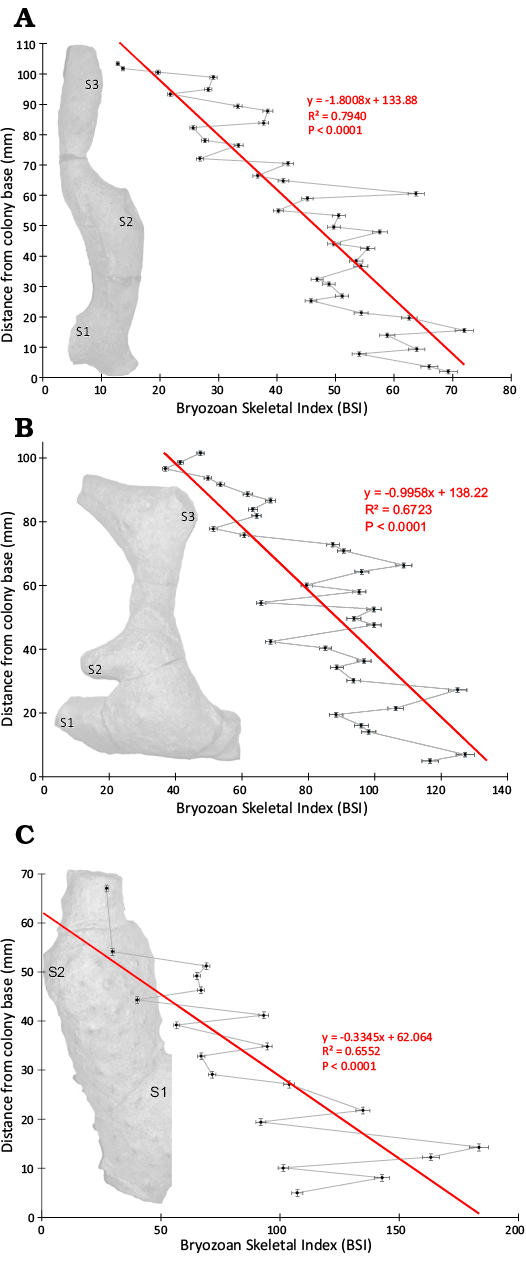
Fig. 5. Plots of Bryozoan Skeletal Index (BSI) from proximal to distal through a colony’s growth transect in the three colonies of Leptotrypella asterica from the Hamilton Group of the Middle Devonian in Leicester, Livingston County, New York State, USA. Abbreviations: S1–3, secondary branches bifurcating off primary branch. A. TCD.60477. B. TCD.60478. C. TCD.60479.
As the colonies grew upward into the water column from their basal attachments, they would have experienced increasing current velocities due to decreasing drag upward away from the sediment-water interface (Dade et al. 2001). BSI was greatest near the colony base (Fig. 5). This would have provided added strength to the colony toward the base due to increasing branch diameter (Key 1991; Wyse Jackson et al. 2020). Bryozoan colonies with narrower branches are more susceptible to breakage (Cheetham and Thomsen 1981). Weaker distal colony branch tips with lower BSI values could more easily break off and regrow without jeopardizing the success of the entire colony through breakage of the stronger base with its higher BSI values. Evidence of breakage and regrowth scars are visible in the originally published longitudinal sections through Leptotrypella asterica (Boardman 1960: pl. 9: 1e, f).
As expected in these large, robust, erect branching bryozoans, secondary skeletal thickening at their proximal regions led to increased BSI values proximally. Therefore, we reject the null hypothesis that there is no variation in BSI in a proximal-distal (developmental) transect through a single colony. Our analytical method can be applied to future studies comparing BSI between taxa or across depth gradients or among colonies with varying abundance of internal borers.
Conclusions
Our closely spaced serial thin sectioning allowed robust quantification of intracolony astogenetic morphometric variation in these trepostome bryozoans. EW decreased significantly distally through the colonies from their bases. ZWT did not vary in any significant pattern distally. MZD decreased significantly distally through two of the colonies. BSI decreased significantly distally through all the colonies. Therefore, ZWT and MZD may be more useful taxonomic characters than EW or BSI due to the former’s reduced intraspecific variation. To minimize intracolony variation, BSI is best measured just below the growing tips at a point along the branch where its diameter has attained its optimal thickness.
Acknowledgements
Michael Miglietta (New York, USA) helped with collecting the colonies in the field. Douglas Reynolds (University of Texas, Arlington, USA) made the closely spaced serial sections. Katie Wyse Jackson (University College Dublin, Ireland) drafted Fig. 2. This manuscript was greatly improved by the critical reviews from Caroline Buttler (Amgueddfa Cymru-National Museum Wales, Cardiff, UK), and an anonymous reviewer.
Editor: Andrzej Kaim
References
Batson, P.B., Tamberg, Y., Gordon, D.P., Negrini, M., and Smith, A.M. 2021. Hornera currieae n. sp. (Cyclostomatida: Horneridae): a new bathyal cyclostome bryozoan with reproductively induced skeletal plasticity. Zootaxa 5020: 257–287. Crossref
Becker, R.T., Marshall, J.E.A., and Da Silva, A.-C. 2020. The Devonian Period. In: F.M. Gradstein, J.G. Ogg, M.D. Schmitz, and G.M. Ogg (eds.), Geologic Time Scale 2020, 733–810. Elsevier, Amsterdam. Crossref
Blakey, R. 2016. Devonian—380 Ma, Global Paleogeography and Tectonics in Deep Time Series. Deep Time Maps™ Paleogeography [available from https://deeptimemaps.com/, last accessed 27 June 2024.
Boardman, R.S. 1960. Trepostomatous Bryozoa of the Hamilton Group of New York State. United States Geological Survey Professional Paper 340: 1–87. Crossref
Boardman, R.S. 1984. Origin of the Post-Triassic Stenolaemata (Bryozoa): a taxonomic oversight. Journal of Paleontology 58: 19–39.
Brett, C.E., Baird, G.C., Bartholomew, A.J., DeSantis, M.K., and Ver Straeten, C.A. 2011. Sequence stratigraphy and a revised sea-level curve for the Middle Devonian of eastern North America. Palaeogeography, Palaeoclimatology, Palaeoecology 304: 21–53. Crossref
Brett, C.E., Baird, G.C., Zambito, J.J., IV., and Bartholomew, A.J. 2023. Stratigraphy and facies of the middle and upper Hamilton Group (Middle Devonian; Givetian) in New York State and adjacent areas. In: C.A. Ver Straeten, D.J. Over, and D. Woodrow (eds.), Devonian of New York, Volume 2: Lower to Upper Givetian (Middle Devonian) Stage. Bulletins of American Paleontology 405–406: 1–195. Crossref
Cheetham, A.H and Thomsen, E. 1981. Functional morphology of arborescent animals: strength and design of cheilostome bryozoan colonies. Paleobiology 7: 355–383. Crossref
Cuffey, R.J. and Fine, R.L. 2006. Reassembled trepostomes and the search for the largest bryozoan colonies. International Bryozoology Association Bulletin 2 (1): 13–15.
Dade, W.B., Hogg, A.J., and Boudreau, B.P. 2001. Physics of flow above the sediment-water interface. In: B.P. Boudreau and B.B. Jorgensen (eds.), The Benthic Boundary Layer: Transport Processes and Biogeochemistry, 4–43. Oxford University Press, Oxford. Crossref
Ernst, A. and Buttler, C.J. 2025. Bryozoan fauna from the Ferques Formation (Upper Devonian, Frasnian) of France. Palaeobiodiversity and Palaeoenvironments 105: 265–281. Crossref
Ernst, A. and Rodríguez, S. 2023. Palaeoecology and palaeobiogeographic relationships of Lower Devonian bryozoans from the Guadámez and Peñón Cortado Sections of Sierra Morena (SW Spain). Spanish Journal of Palaeontology 38: 1–48. Crossref
Gowan, S.W., Trader, S.M., Piel, M.E., and Milliken, L.D. 2006. Stratigraphy of the Devonian and Upper Silurian in the Vicinity of the Retsof, Sterling and Hampton Corners Mines in Livingston County, New York. New York State Museum, Map and Chart Series 45: 1–72.
Key, M.M., Jr. 1990. Intracolony variation in skeletal growth rates in Paleozoic ramose trepostome bryozoans. Paleobiology 16: 483–491. Crossref
Key, M.M., Jr. 1991. How to build a ramose trepostome. In: F.P. Bigey and J.-L. d’Hondt (eds.), Bryozoa: Living and Fossil, 201–207. Société des Sciences Naturelles de l’Ouest de la France, Mémoire hors série, Nantes.
Key, M.M., Jr., Nestell, M.K., Wyse Jackson, P.N., and Reynolds, D.D. (in press). Closely spaced serial sectioning reveals intracolony variation in Devonian erect trepostome bryozoan branch morphology. Sessile Organisms [accepted].
Key, M.M., Jr., Thrane, L., and Collins, J.A. 2001. Space-filling problems in ramose trepostome bryozoans as exemplified in a giant colony from the Permian of Greenland. Lethaia 34: 125–135. Crossref
Key, M.M., Jr., Thrane, L., and Collins, J.A. 2002. Functional morphology of maculae in a giant ramose bryozoan from the Permian of Greenland. In: P.N. Wyse Jackson, C.J. Buttler, and M.E. Spencer Jones (eds.), Bryozoan Studies 2001, 163–170. Balkema Publishers, Lisse. Crossref
Key, M.M., Jr., Wyse Jackson, P.N., and Felton, S.H. 2016. Intracolony variation in colony morphology in reassembled fossil ramose stenolaemate bryozoans from the Upper Ordovician (Katian) of the Cincinnati Arch region, USA. Journal of Paleontology 90: 400–412. Crossref
Key, M.M., Jr., Wyse Jackson, P.N., and Reid, C.M. 2022. Trepostome bryozoans buck the trend and ignore the calcite-aragonite seas. Palaeobiodiversity and Palaeoenvironments 102: 253–263. Crossref
Key, M.M., Jr., Wyse Jackson, P.N., and Vitiello, L.J. 2011. Stream channel network analysis applied to colony-wide feeding structures in a Permian bryozoan from Greenland. Paleobiology 37: 287–302. Crossref
Madsen, L. 1987. Growth and polypide morphology in some ramose trepostome bryozoans from ther Permo-Carboniferous of the Arctic. In: J.R.P. Ross (ed.), Bryozoan: Present and Past, 169–176. Western Washington University, Bellingham.
Nye, O.B., Jr., Dean, D.A., and Hinds, R.W. 1972. Improved thin section techniques for fossil and recent organisms. Journal of Paleontology 46: 271–275.
Reid, C.M., Wyse Jackson, P.N., and Key, M.M., Jr. 2023. Latitudinal influences on bryozoan calcification through the Paleozoic. Paleobiology 49: 271–283. Crossref
Wyse Jackson, P.N. and Buttler, C.J. 2015. Part G, Revised, Volume 2, Chapter 3: Preparation, imaging, and conservation of Paleozoic bryozoans for study. Treatise Online 63: 1–15. Crossref
Wyse Jackson, P.N. and Key, M.M., Jr, 2019. Epizoan and endoskeletozoan distribution across reassembled ramose stenolaemate bryozoan zoaria from the Upper Ordovician (Katian) of the Cincinnati Arch region, USA. Australasian Palaeontological Memoirs 52: 169–178.
Wyse Jackson, P.N., Key, M.M., Jr., and Reid, C.M. 2020. Bryozoan Skeletal Index (BSI): a measure of the degree of calcification in stenolaemate bryozoans. In: P. Wyse Jackson and K. Zágoršek (eds.), Bryozoan Studies 2019, 193–206. Czech Geological Society, Prague.
Wyse Jackson, P.N., Key, M.M., Jr., and Reid, C.M. 2023. Skeletonisation in the stenolaemate bryozoan orders Cryptostomata (Suborder Rhabdomesina) and Trepostomata: the role of the Bryozoan Skeletal Index (BSI) as a taxonomic character. In: M.M. Key, Jr., J.S. Porter, and P.N. Wyse Jackson (eds.), Bryozoan Studies 2022, 169–181. CRC Press, Boca Raton. Crossref
Wyse Jackson, P.N., Key, M.M., Jr., and Reid, C.M. (in press). Ordovician (Sandbian–Katian) stenolaemate bryozoan colony growth history reflected in the Bryozoan Skeletal Index (BSI). Sessile Organisms [accepted].
Acta Palaeontol. Pol. 71 (2): 211–218, 2026
https://doi.org/10.4202/app.01317.2025